Benemérita Universidad Autónoma de Puebla publishes a Licenciatura en Actuaría map leading to Licenciado(a) en Actuaría. This independent guide concerns BUAP in Puebla, Mexico, not an INTIAU award or partnership.
Read the plan and its internal distinctions
The Plan 2016 map separates basic and formative study and displays nine academic periods. It reports 296 minimum and 314 maximum credits. The faculty webpage instead reports 295–313, so the two published totals do not fully agree. Confirm the applicable cohort audit with BUAP rather than silently combining them. Inspect the map and its progression.
| Published level | Selected actual courses, translated |
|---|---|
| Basic mathematical study | Linear Algebra I; Differential and Integral Calculus; Probability I–II |
| Computing and finance | Actuarial Software I–III; Linear Programming; Corporate Finance |
| Formative specialisation | Stochastic Processes; Pension Plan Valuation; Loss Models; Econometrics |
| Integration and practice | Data Analysis; Comprehensive Risk Management; social service and professional practice |
The faculty labels Plan 2016 as vigente and describes an entry profile involving algebra, mathematical abstraction, analysis, Spanish communication and reading English. Those language skills are not a claim that the programme is delivered wholly in English.
Use this structure to compare actuarial study with a general mathematics or finance degree. Ask where a mathematical technique becomes a model of an uncertain event, and where its result must be explained to a decision-maker. Knowing how to calculate a value and knowing what the value represents are separate achievements. Keep both in your preparation notes.
A real outline: Modelos de Pérdida
The six-credit Loss Models outline, updated in June 2017, connects claim frequency and severity with aggregate losses. Its named themes include survival and distribution functions, moments and tail behaviour, continuous and discrete models, deductibles, policy limits and coinsurance. It also addresses how coverage changes affect payments. These are actual selected outline themes; a 2017 document does not verify an unchanged 2027 weekly syllabus. Read the course document.
For a useful reading task, write a plain-language description beside each mathematical object you encounter. Is the quantity an event count, a monetary amount, a probability or a rule that changes what is paid? Treating all four as merely “risk” obscures the problem. A model comparison should also state which observations were available and which assumptions were introduced.
The admission year is separate from the curriculum edition
The 2026 higher-education call covers entry in August 2026 and January 2027. Its process includes an application, document validation and EXANI-II-EPIU assessment, followed by results and registration. Applicants with studies outside Mexico are directed to obtain their specific procedure before beginning. The reviewed call is a dated process; Spring 2027 entry is not evidence of a newly open registration window on 17 October 2026. Use the actual call for your route.
Prepare separate records for eligibility, selection and final enrolment. A course-interest statement does not replace an admission document, and a future start term does not establish when the application was due. If the two credit totals matter for a transfer or later application, request the institution’s answer tied to the exact plan and cohort.
Original exercise: distinguish frequency from severity
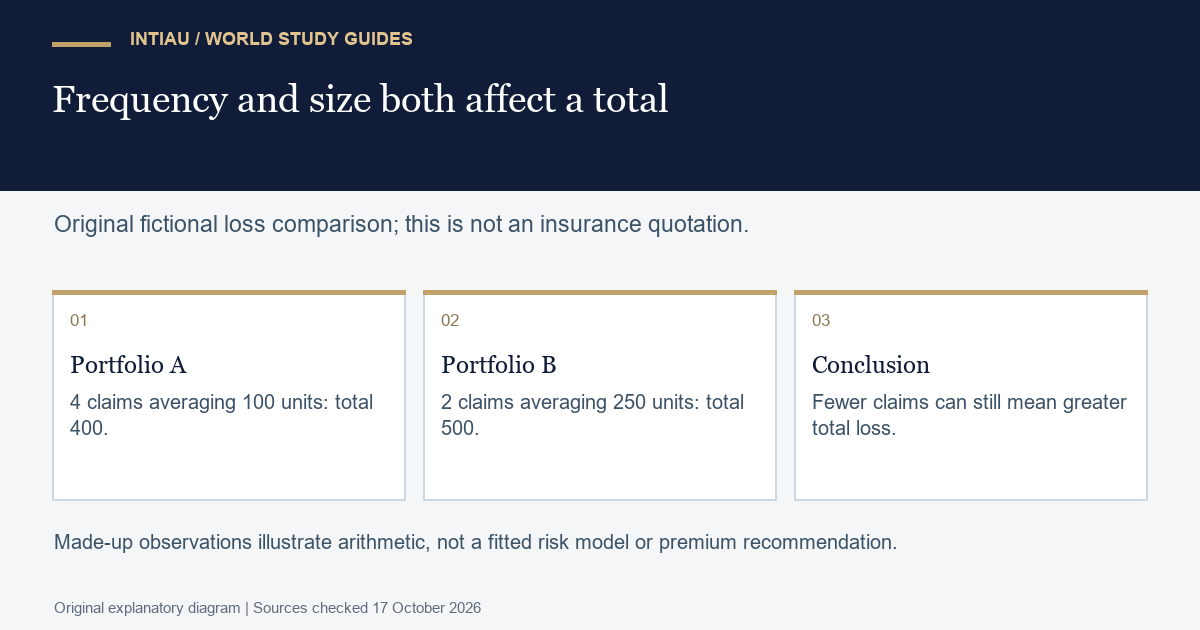
Take two fictional portfolios over the same observation period. A has four claims averaging 100 units, giving a total of 400. B has two claims averaging 250 units, giving 500. B has fewer claims but the larger total. A statement that B is “lower risk because it has half as many claims” therefore leaves out the size of the claims.
Now ask whether the portfolios contain equal numbers of covered items and equal exposure periods. Without that information, even a frequency comparison may be misleading. Write a conclusion limited to the observed totals, then list the extra data needed to compare rates. Do not turn the example into a premium or reserve recommendation: these invented observations do not constitute a fitted statistical model. This exercise is original and is not a BUAP examination question.
Questions to settle
Do the two published credit totals agree?
No. The reviewed map says 296–314; the faculty summary differs by one credit at each end.
Does the loss course study only claim counts?
No. Its outline includes severity, aggregate losses and changes in coverage.
Does a January 2027 start mean applications are newly open?
No. That term belongs to the dated 2026 admission process.
Official reading
- Actuaría map (plan 2016)
- Faculty programme listing (2016 plan labelled vigente)
- Loss Models outline (updated 28 June 2017)
- Higher-education registration call (2026)
For other study topics, browse INTIAU Courses; use Contact for questions about INTIAU services. University applications belong with the institution named above.
Related guides
View the study diagram