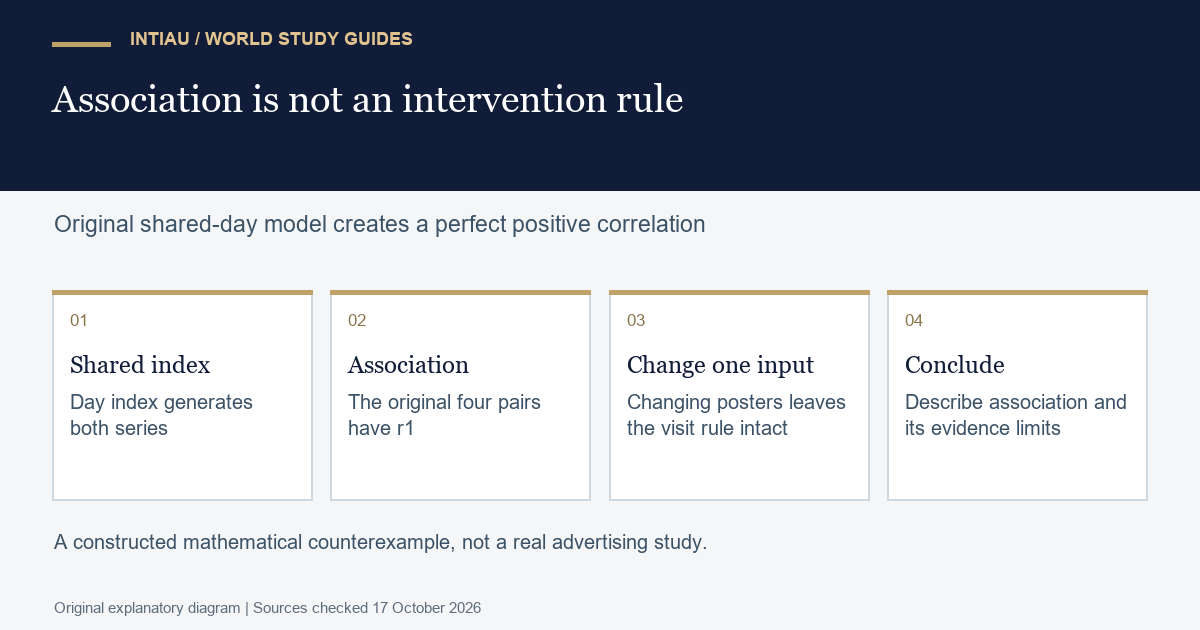
A perfect association can be easy to calculate and still fail to support a causal story. This workshop creates two fictional series from the same day index. You will calculate their correlation, inspect the rule that generated each series and explain why changing one series need not change the other in this constructed model. It is a reasoning exercise, not an experiment on people.
Documentation boundary
SciPy’s pearsonr reference describes the Pearson coefficient as measuring a linear relationship, ranging from minus one to plus one. The original calculation below implements the coefficient for this small fixture; it does not call SciPy, report a p-value or claim an inferential test.
Inspect the construction before interpreting it
For day index z, define posters as two times z plus one and visits as ten times z. Use the four indices one through four. These are invented counts, not observations from an advertising campaign. Both series increase with the same index, and the visit rule contains no poster term. That construction is visible evidence about this mathematical scenario; it is not a hidden explanation inferred from actual human behaviour.
| Day index | Fictional posters | Fictional visits | Generating rule |
|---|---|---|---|
| 1 | 3 | 10 | Both depend on day index |
| 2 | 5 | 20 | Same two rules |
| 3 | 7 | 30 | Same two rules |
| 4 | 9 | 40 | Same two rules |
Your tasks are to predict the direction of association, calculate the coefficient and write a sentence that does not say posters caused visits. Then change only the first poster value to thirty while retaining the visit-generation rule. Predict whether the constructed visits change. The second task tests a causal claim against the model definition rather than against the visual appeal of two rising lines.
Work the coefficient and counterexample
from math import sqrt

def pearson(x, y):
    if len(x) != len(y) or len(x) < 2:
        raise ValueError("paired observations required")
    mx, my = sum(x) / len(x), sum(y) / len(y)
    dx, dy = [v - mx for v in x], [v - my for v in y]
    denominator = sqrt(sum(v*v for v in dx) * sum(v*v for v in dy))
    if denominator == 0:
        raise ValueError("constant input")
    return sum(a*b for a, b in zip(dx, dy)) / denominator

days = [1, 2, 3, 4]
posters = [2*z + 1 for z in days]
visits = [10*z for z in days]
assert abs(pearson(posters, visits) - 1) < 1e-12
changed_posters = [30, 5, 7, 9]
unchanged_visits = [10*z for z in days]
assert unchanged_visits == visits
assert pearson(changed_posters, visits) != 1
print("original r1; changing posters alone leaves model visits unchanged")
The original coefficient is one, within ordinary floating-point rounding tolerance. Every pair lies on the same increasing straight-line relationship. When the first poster value becomes thirty, the visit values stay ten, twenty, thirty and forty because their stated generating rule is unchanged. The correlation is no longer one. This controlled mathematical alteration shows why the first association did not establish that the visit rule depended on posters.
A defensible conclusion says that the two constructed series have perfect positive linear association in the four supplied pairs. It also says that both were defined from a shared day index and that the model does not include a poster effect on visits. Do not generalise this to all advertising, all visitor behaviour or every possible causal structure. The workshop establishes a limit in one transparent construction.
Diagnose overclaiming
A statement such as “every extra poster produced five visits” confuses the slope visible across the paired values with an intervention rule. The construction implies visits equal five times posters minus five only while both series follow their original day-based formulas. That algebraic relationship is not the same as defining visits to respond when someone changes posters independently. Point to the missing intervention evidence rather than merely repeating a slogan.
The small example also supplies no random sampling, assignment process or measurement protocol. Therefore do not attach a population estimate, a statistical significance claim or an effectiveness recommendation to it. Adding more decimal places to the coefficient would not supply those missing design features. A precise description of what was calculated is more useful than a stronger claim supported only by numerical neatness.
Write a limited evidence statement
Submit the paired table, the coefficient, the generating rules and the changed-poster result. Draw a simple arrow sketch in which day index feeds both posters and visits, with no asserted poster-to-visit arrow. Label the sketch as the original exercise model. Then list what a real causal investigation would need to establish beyond these paired values, including a credible way to distinguish alternative explanations.
For further practice, reverse the visit list while keeping posters unchanged. The coefficient becomes minus one, demonstrating a perfect decreasing association. It still does not create a poster intervention rule. Compare the wording of your positive and negative association statements and keep their causal limitations consistent. The goal is a reusable habit of matching the strength of a conclusion to the evidence actually available.
Questions for this exercise
What relationship does the coefficient describe?
The documented Pearson coefficient measures linear association between paired values, with its scale running from minus one to plus one.
Does this model make posters cause visits?
No. Visits are explicitly generated from the day index; changing posters alone does not change that rule.
Does the exercise report a significance test?
No. It reports an original descriptive calculation and a model-based counterexample, without a p-value or population claim.
Official documentation
Explore the Courses overview or use Contact for general enquiries. This is an original INTIAU editorial self-study exercise; no qualification is awarded.
Related guides
View the study diagram