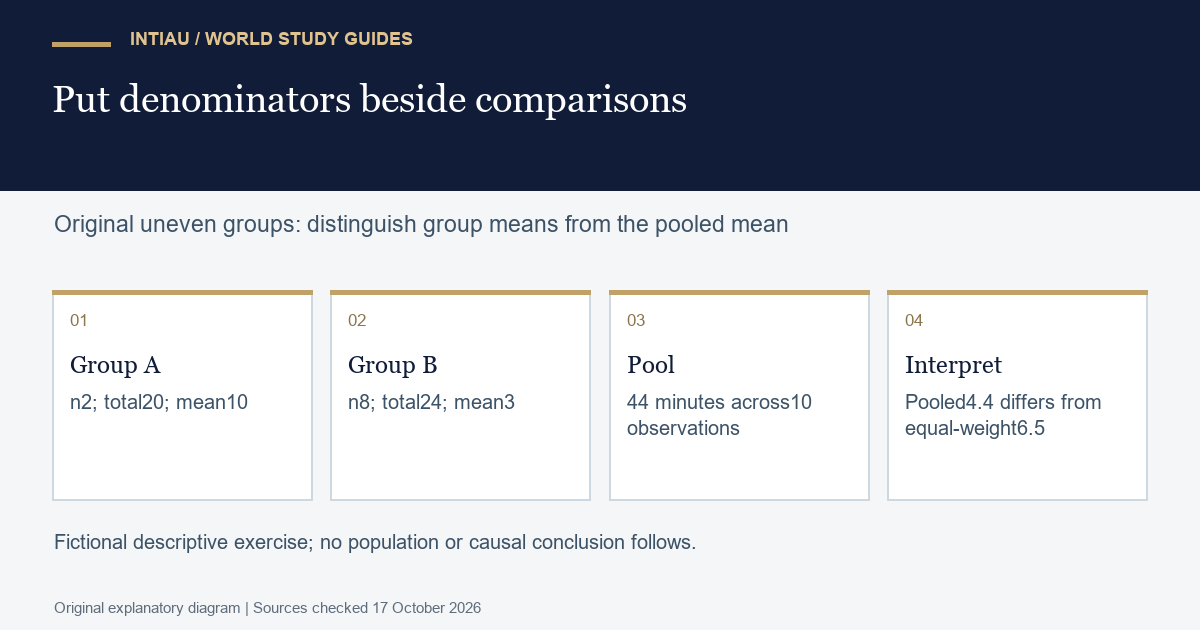
Two groups can have different averages and very different amounts of evidence. This workshop compares fictional processing times from a small pilot group and a larger comparison group. You will report the group sizes before interpreting the averages, preserve the full ranges and distinguish an average over observations from an equal-weight average over groups. No claim about a real process is involved.
Documentation boundary
Python’s statistics documentation provides mean and median. The mean is based on the sum divided by the number of observations; the median describes the middle of ordered observations. These functions calculate summaries but do not establish how the samples were selected or whether groups are comparable.
Define the comparison question
Group A contains times eight and twelve minutes. Group B contains seven one-minute observations and one seventeen-minute observation. First ask which group has the lower observed average. Separately ask for the average time across all ten observations. Do not replace the second question with an equal-weight comparison of two group summaries: that would give each group the same influence regardless of its number of observations.
| Summary | Group A | Group B |
|---|---|---|
| Observation count | 2 | 8 |
| Total minutes | 20 | 24 |
| Mean minutes | 10 | 3 |
| Median minutes | 10 | 1 |
| Minimum to maximum | 8 to 12 | 1 to 17 |
Before running the answer, calculate both totals and check that the two group sizes sum to ten. Notice that B has a larger total despite a lower mean, because it contains more observations. A claim based only on totals would answer a different question from a claim based on time per observation. Name the unit and denominator beside every summary.
Work the comparison and pooling
from statistics import mean, median

group_a = [8, 12]
group_b = [1, 1, 1, 1, 1, 1, 1, 17]
assert (len(group_a), mean(group_a), median(group_a)) == (2, 10, 10)
assert (len(group_b), mean(group_b), median(group_b)) == (8, 3, 1)
assert mean(group_a + group_b) == 4.4
assert mean([mean(group_a), mean(group_b)]) == 6.5
assert sum(group_a) == 20 and sum(group_b) == 24
print("A:n2 mean10; B:n8 mean3; pooled mean4.4")
The observed group means are ten for A and three for B. The combined total is forty-four minutes over ten observations, so the pooled mean is 4.4. The arithmetic average of the two group means is 6.5. That second value is a valid equal-weight summary of two group averages, but it is not the mean time of the ten observations. The question determines which calculation is appropriate.
The median and range add useful detail. B has a median of one and a maximum of seventeen, so its mean alone conceals a long observation. A has only two observations, making its summary especially dependent on those two cases. The dataset is constructed for arithmetic practice. It provides no sampling design, uncertainty estimate or evidence that either group would behave similarly in a larger study.
Diagnose a sweeping conclusion
A report saying “B is always faster” is contradicted by its own range: seventeen exceeds both A values. A report saying “A produced less total waiting” may be numerically true here but does not show a lower per-observation time. Repair each statement by making the denominator and scope explicit. A defensible sentence says that the observed mean is lower in B in this ten-record fictional fixture.
Do not infer that increasing sample size itself caused the lower mean. The group values differ as well as the group sizes. Nor should you duplicate A’s two rows until it has eight records; copying observations does not add new evidence. If balanced groups matter to a later task, plan how additional observations would be obtained rather than manufacturing them from the existing rows.
Prepare a compact comparison handover
Submit the summary table, the pooled calculation and a corrected conclusion. Explain the difference between 4.4 and 6.5 in one sentence without calling either number a software error. Then identify two missing pieces of study context, such as the observation-selection rule and whether conditions were comparable. This separates a correct calculation from a well-supported interpretation.
For an extension, remove B’s seventeen-minute value only in a clearly labelled sensitivity exercise. B then has seven observations with mean one, while A is unchanged. The new combined mean is three across nine observations. Explain that this is a different dataset, not a correction justified by the original information. Keep both summaries visible so the effect of the changed inclusion rule can be assessed.
Questions for this exercise
Do mean and median explain the sampling design?
No. The documented functions calculate summaries; the way observations were selected needs separate evidence.
Why is the pooled average 4.4 rather than 6.5?
There are ten observations with total 44. The value 6.5 weights the two group means equally instead.
Can I duplicate A’s rows to balance the groups?
That would copy observations without adding evidence. It is not a substitute for additional independently collected records.
Official documentation
Explore the Courses overview or use Contact for general enquiries. This is an original INTIAU editorial self-study exercise; no qualification is awarded.
Related guides
View the study diagram