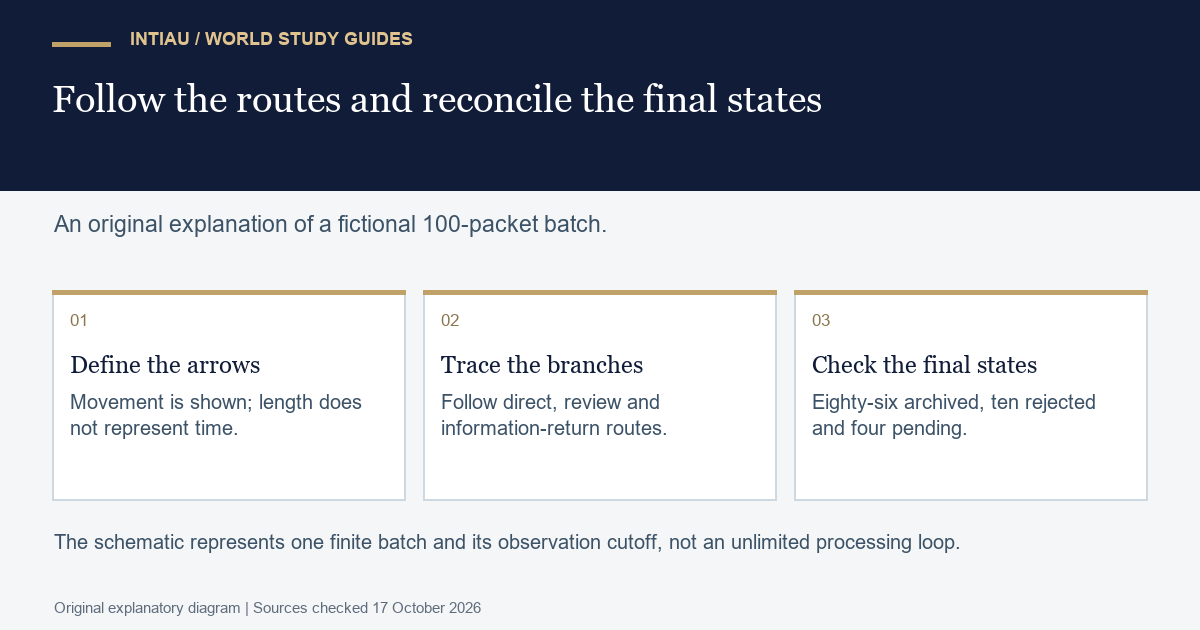
This self-study workshop turns a branching process diagram into a spoken explanation a listener can follow. You will define the arrows, trace one batch, check that the totals reconcile and distinguish a route from a claim about speed. The output is a complete explanation and a paper plan for introducing the diagram in stages.
Choose the message and supporting evidence
The MIT Biological Engineering guide to figure design connects a figure’s message with the evidence supporting it and the needs of its audience. It also notes that a presentation setting changes how a figure can be introduced and explained.
Our original fictional diagram represents one batch of 100 model archive packets. Arrows mean movement of packets, not time, importance or causal strength. Ten packets are rejected at intake. Of the remaining ninety, sixty go directly to archive and thirty require review. Review sends twenty to archive and ten to an information-request stage. Six of those ten return with information and reach archive; four remain pending at the observation cutoff.
Write a legend before tracing the flow
| Route or state | Packets | Meaning at the cutoff |
|---|---|---|
| Intake to rejection | 10 | Not archived |
| Direct route to archive | 60 | Archived without review |
| Review to archive | 20 | Archived after review |
| Information returned, then archive | 6 | Archived after an additional step |
| Still awaiting information | 4 | Pending, not a rejection or archive completion |
| Total final states | 100 | 10 rejected + 86 archived + 4 pending |
Sketch boxes labelled intake, triage, review, information request, archive and rejection. Draw the routes described above and write each count beside its arrow. The information-return route ends in archive for this batch; it does not generate an unlimited loop. Keep “four pending at cutoff” beside the information-request box.
Read the complete worked explanation
“This diagram follows one fictional batch of 100 packets. Each arrow shows where packets move; its length does not represent time. Start at intake: ten are rejected and ninety continue. Sixty of those ninety go directly to archive, while thirty enter review. Review sends twenty more to archive and asks for information on ten. Six later return with that information and are archived; four are still pending at the cutoff. The archive therefore contains sixty plus twenty plus six, or eighty-six packets. Together with ten rejections and four pending packets, that accounts for the original hundred. The diagram shows routes and final states, not how quickly each route operates.”
The answer gives the legend before the branches, then follows a consistent direction. It reconciles the final states rather than adding every arrow count. Adding ninety, sixty, thirty and twenty would count some packets multiple times because those are successive movements within the same batch.
Introduce the diagram in three stages
First show or describe the intake and final-state boxes, explaining that one batch is being tracked. Next trace the direct route and the review branch. Finally introduce the information-request route and its cutoff. This staging is a paper communication plan; no animation, script or interactive diagram is embedded in the article.
Use a pointer sentence at each change of focus: “Now follow the thirty entering review,” and “Of the ten awaiting information, six have returned by the cutoff.” These phrases tell the listener which denominator matters. Avoid “and then these go over here,” which loses meaning when a listener cannot identify the box being indicated.
Diagnose three misleading explanations
“All ten requests failed” confuses pending information with failure: six returned and four remain unresolved. “The direct route is faster” adds a timing claim not present in the diagram. “There were 190 packets because 100 entered and 90 continued” counts the continuing packets twice. Repair each statement by returning to the route ledger and the stated arrow meaning.
For an extra variation, change the six returned packets to eight while leaving the ten information requests unchanged. The final answer becomes eighty-eight archived, ten rejected and two pending, still totalling one hundred. The review-entry count remains thirty; changing a later outcome does not create new intake packets.
Use a five-point explanation rubric
Award one point for defining the arrows, one for a clear starting point, one for naming the branching denominators, one for reconciling final states and one for avoiding unmeasured speed or causal claims. The worked explanation earns five. A fluent tour of every box loses the totals point if it counts the same packets repeatedly.
Do arrow lengths show processing duration?
No. This fictional legend defines arrows as movement only. Timing would need an additional measure and an explicit visual encoding.
Are pending packets the same as rejected packets?
No. Four are awaiting information at the cutoff, while ten were rejected. Keeping those states separate is necessary to explain the final total accurately.
Must I build an animated diagram?
No. A labelled paper sketch, the route ledger and the complete spoken explanation are sufficient. Staging the explanation does not require software or embedded animation.
This is original INTIAU editorial self-study practice; no qualification is awarded. Use Courses for study navigation and Contact for editorial enquiries.
Related guides
View the study diagram