This self-study workshop turns a small fictional results sheet into an accurate report. You will preserve denominators, distinguish completed tasks from failed tasks and move unsupported explanations out of the results paragraph. The finished output includes a checked table, a complete results paragraph and a separate list of questions for discussion.
Report the finding before explaining its cause
The USC Libraries guide to results sections recommends a logical presentation of findings. It distinguishes reporting a pattern from speculating about why it occurred, placing that explanatory work in the discussion rather than treating it as an observed result.
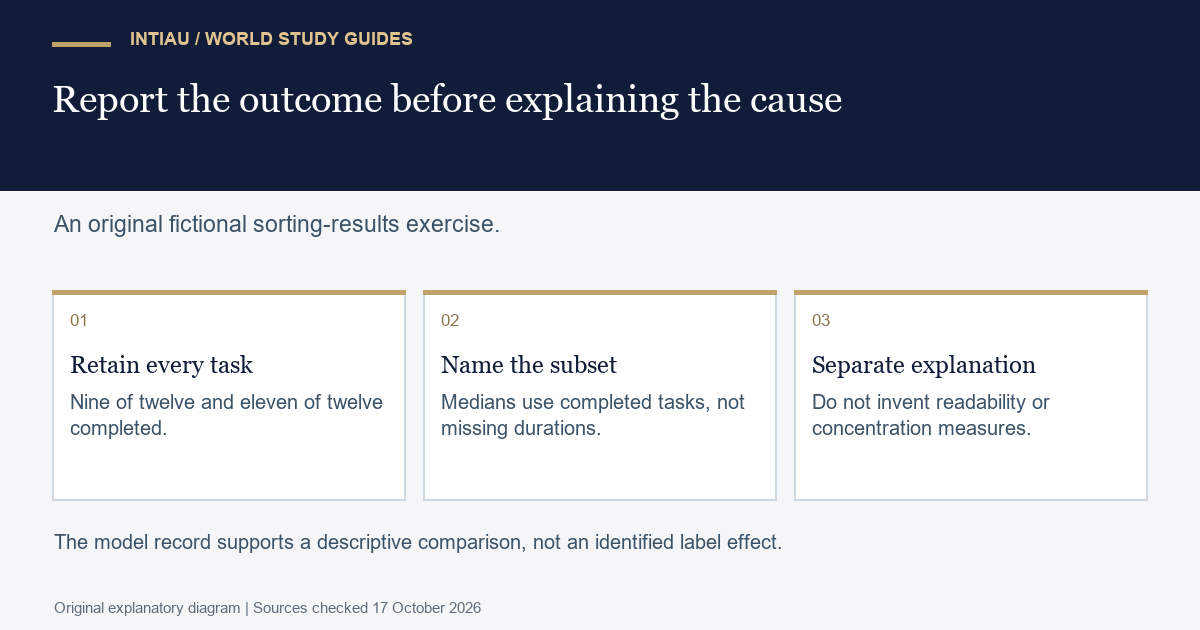
All data in this activity are invented. Two separate sets of twelve parcel-sorting tasks used label A or label B. Nine A tasks and eleven B tasks finished within the mock session. The supplied times below belong only to those completed tasks. The unfinished tasks have no completion times. Allocation and prior practice were not documented.
Reconstruct the table
| Measure | Label A | Label B |
|---|---|---|
| Assigned tasks | 12 | 12 |
| Completed tasks | 9 | 11 |
| Unfinished tasks | 3 | 1 |
| Completed-task times, seconds | 30, 34, 38, 40, 42, 46, 50, 54, 60 | 20, 25, 29, 30, 32, 35, 37, 41, 43, 48, 55 |
| Median among completed tasks | 42 seconds | 35 seconds |
Check the medians before drafting. In A’s ordered list of nine completed times, the fifth value is 42. In B’s list of eleven, the sixth is 35. Subtracting gives seven seconds. That is the difference between two completed-task medians, not the time saved on every task or an estimate that includes unfinished attempts.
Write the complete worked results paragraph
A suitable answer is: “Nine of twelve label A tasks and eleven of twelve label B tasks were completed during the mock session. Among completed tasks, the median recorded duration was 42 seconds for A and 35 seconds for B, a difference of seven seconds. Three A tasks and one B task remained unfinished, so no completion times were available for those attempts. The completed-task time comparison therefore uses nine and eleven records respectively.”
The paragraph reports the completion counts before comparing the available times. It gives the denominator for each result and states the missing information. It does not replace the missing times with zero, the session limit or the mean of completed tasks. Any such replacement would be an additional analytical choice, not an observation in this dossier.
You could also report completion proportions as 75 percent and approximately 91.7 percent. If you do, retain the counts so the rounding is visible. The difference is approximately 16.7 percentage points. Calling it “a 16.7 percent improvement” would blur the distinction between a percentage-point difference and a relative calculation.
Sort explanation from observation
Consider three extra sentences. “B was easier to read” is an explanation without a readability measure. “B increased concentration” names a process that was not recorded. “The B set contained two more completed tasks” is a direct comparison of the supplied counts. Retain the third in results if it is useful; move the first two to a list of hypotheses that require evidence, rather than presenting them as findings.
A responsible discussion note could say: “The record does not distinguish label design from group allocation or prior practice. A future comparison should document those conditions before attributing the observed differences to the labels.” This is not part of the numerical results paragraph. Keeping it separate helps a reader see which statements are recorded outcomes and which concern interpretation or design.
Audit the report using five checks
Award one point for completion counts with denominators, one for correct completed-task medians, one for naming the different time-analysis sample sizes, one for preserving unfinished attempts and one for excluding unsupported mechanisms. The model earns five. A polished sentence that drops the three unfinished A tasks loses the missing-data point even if its two medians are correct.
For an alternative fictional dossier, add ten seconds to each completed B time: 30, 35, 39, 40, 42, 45, 47, 51, 53, 58 and 65. B’s median is then 45 seconds, three seconds higher than A’s 42. The completion counts and missing-data statements remain unchanged. This is a different dataset, not a valid change to the median while retaining the original times. Revise the time comparison to follow the new evidence.
Should unfinished tasks be assigned a duration of zero?
No. The fictional sheet contains no completion time for them. Zero would incorrectly describe an instantaneous completion and distort a summary of durations.
Does a lower completed-task median prove B is faster overall?
No. It describes the available completed records. The unfinished attempts and undocumented allocation prevent that broader conclusion from following directly.
Can results contain a comparison?
Yes. The model compares recorded counts and medians. Its boundary is unsupported explanation, such as claiming that concentration caused the difference without measuring concentration.
This is original INTIAU editorial self-study practice; no qualification is awarded. Use Courses for study navigation and Contact for editorial enquiries.
Related guides
View the study diagram